Clean • Professional
A memory leak in Java happens when objects are no longer needed but still cannot be garbage collected because some part of the program holds a reference to them.
While Java has automatic garbage collection, memory leaks can still occur due to improper handling of references.
Memory leaks reduce available heap space, cause performance issues, and may lead to OutOfMemoryError.
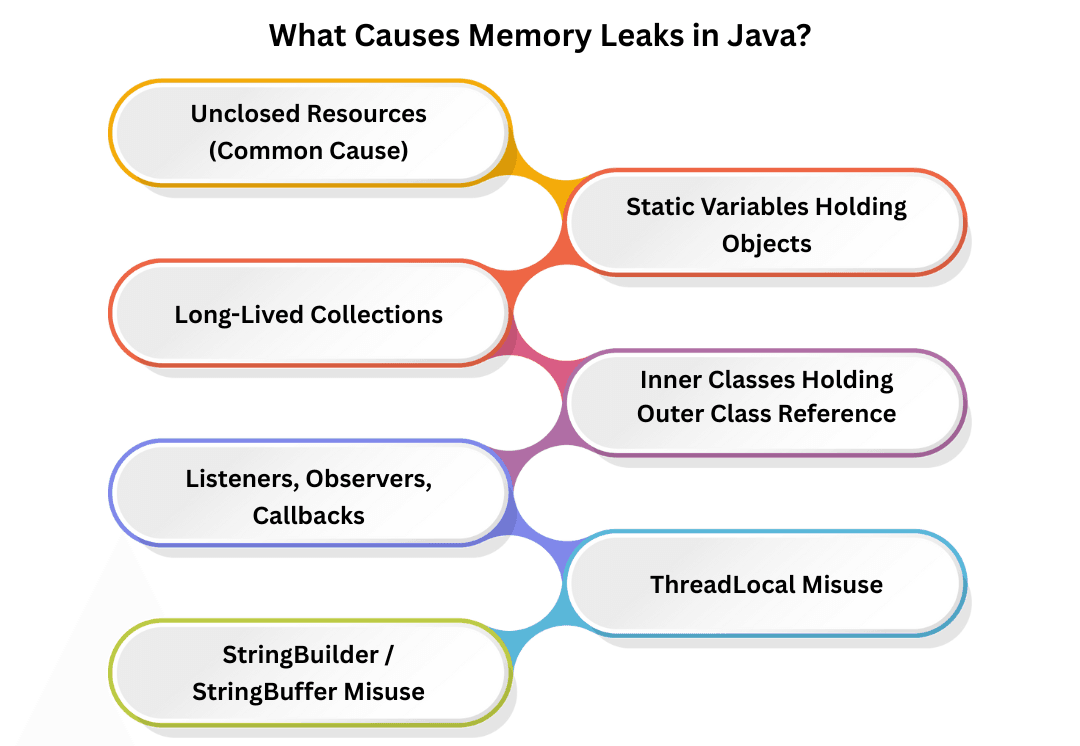
The most common sources of leaks are:

Resources like:
If not closed properly, they occupy memory permanently.
Example:
FileInputStream fis = new FileInputStream("data.txt");
//  Not closed → memory leak
Always use try-with-resources.
Static variables live till the program ends.
If they store large objects → memory leak.
static List<String> cache = new ArrayList<>(); // Grows forever
Collections like:
If items are added but never removed → memory leak.
Example:
Map<String, Object> map = new HashMap<>();
map.put("key", new Object()); //  stays in memory forever if not removed
Anonymous or inner classes implicitly hold a reference to their outer class.
If used inside static contexts → leak risk.
Forgotten registrations cause memory retention.
button.addListener(listener); // Never removed
ThreadLocal values remain until:
If not removed, they cause leaks in thread pools.
Large temporary buffers kept in memory cause leaks.

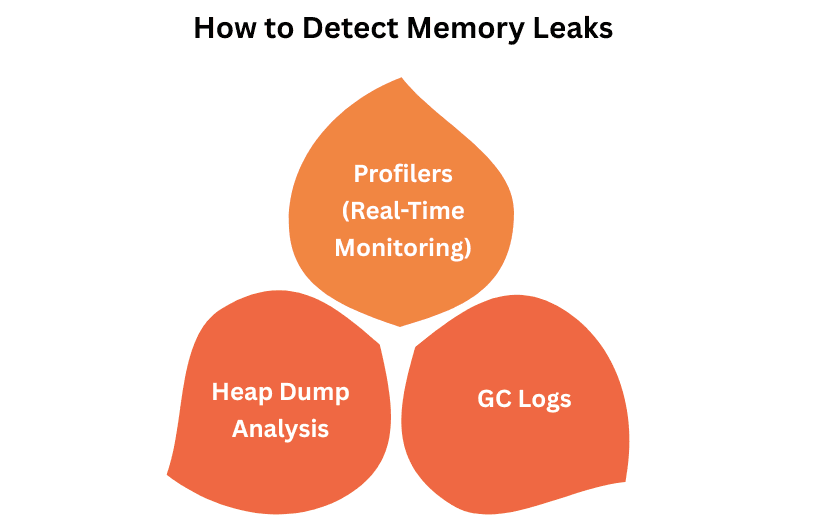
Tools:
Check for:
Track:
Enable GC logs to identify unusual heap retention:
-XX:+PrintGCDetails -XX:+PrintGCTimeStamps
public class LeakExample {
    private static List<int[]> list = new ArrayList<>();

    public static void main(String[] args) {
        while (true) {
            list.add(new int[100000]); //  continuously growing
        }
    }
}
Eventually → OutOfMemoryError.
Automatically closes resources.
try (FileInputStream fis = new FileInputStream("a.txt")) {
    // code
}
list.remove(obj);
map.clear();
Don’t store huge data in static variables.
object = null;
(Learn this in next topic)
button.removeListener(listener);
Always remove:
threadLocal.remove();
Set alerts for:
class Cache {
    private static Map<String, byte[]> images = new HashMap<>();

    public static void loadImage(String key) {
        images.put(key, new byte[5 * 1024 * 1024]); // 5 MB each
    }
}
Large cache + no eviction → heavy memory leak.
Use: